

This guide will walk you through how to report on quotas and goals using Copper’s reporting system.
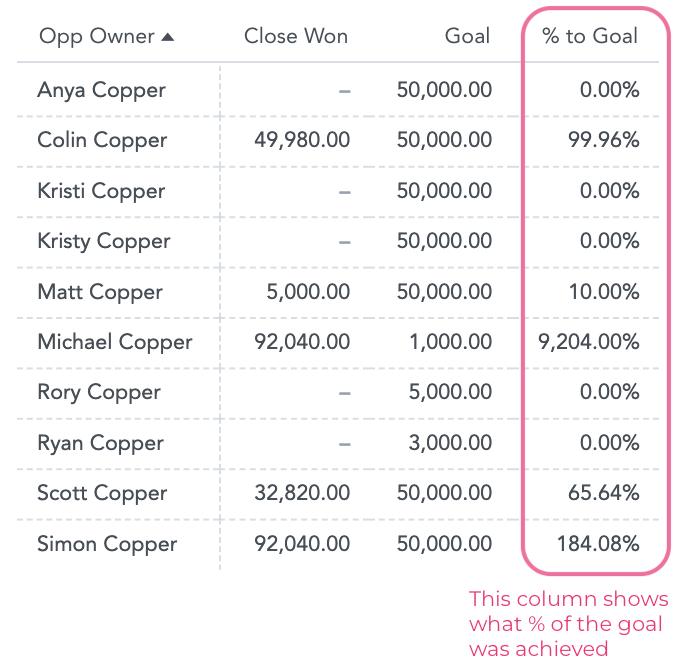
While our reporting system doesn’t have a built-in goal-setting function, you can replicate that functionality using a purpose-built Pipeline. The result will look like this:
Follow the instructions below to set this up.
Setting up the Goals Pipeline & Opportunities
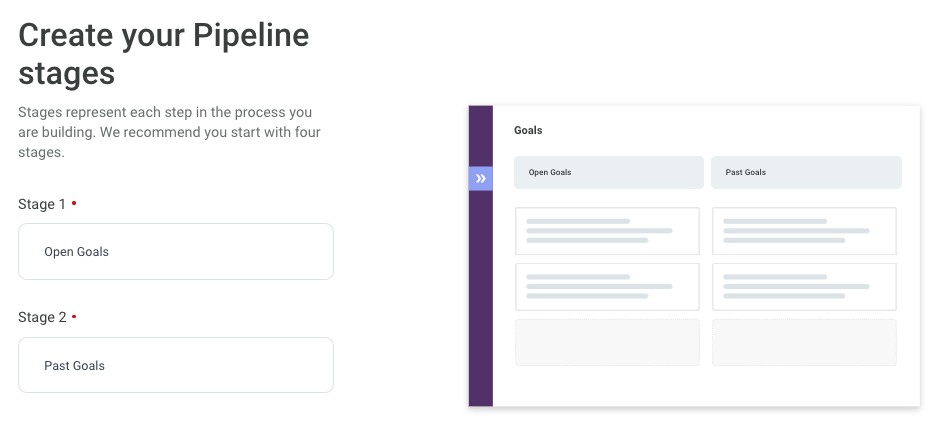
First, you need to set up a dedicated Pipeline to track your team’s goals. We recommend having stages for Open Goals and Past Goals, although the specific stages won’t affect the way you set up the report later on.
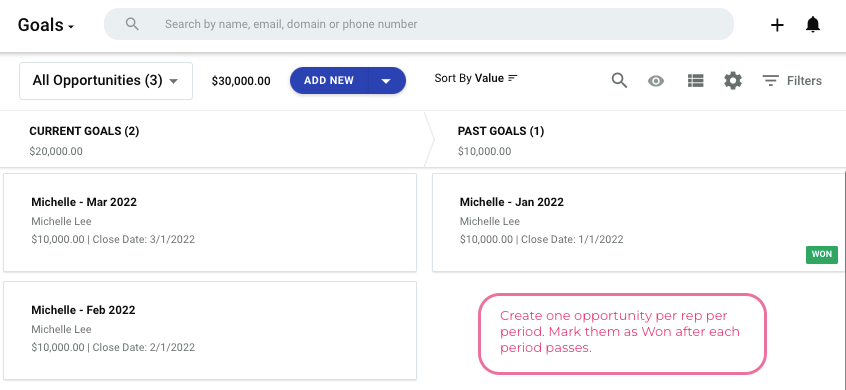
Then, you will create one Opportunity for each rep’s goal for each time period. For example, if your team has monthly goals, then you will create one Opportunity for each month for each rep. Make sure you:
- Set the Value to their quota or goal amount
- Set the Close Date to the first day of the quota period. For monthly goals, this would be the first of the month. For quarterly goals, this would be the first day of the quarter.
- Set the appropriate user as the Owner for each Opportunity.
Building the Insight
Once you’ve set up your Goals Pipeline & Opportunities, head over to the Reports area in the Copper web app.
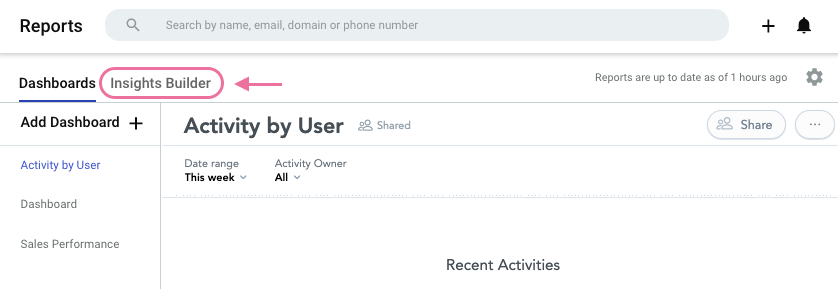
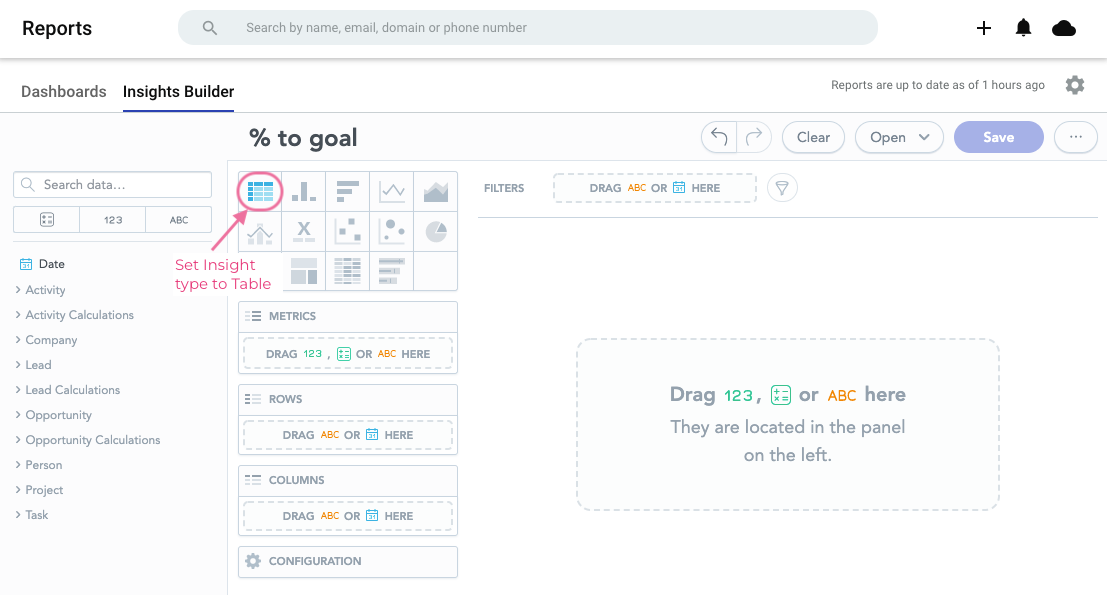
Enter a title for your Insight. In this example, we’re going to build a Table but you could also build a Bullet Chart.
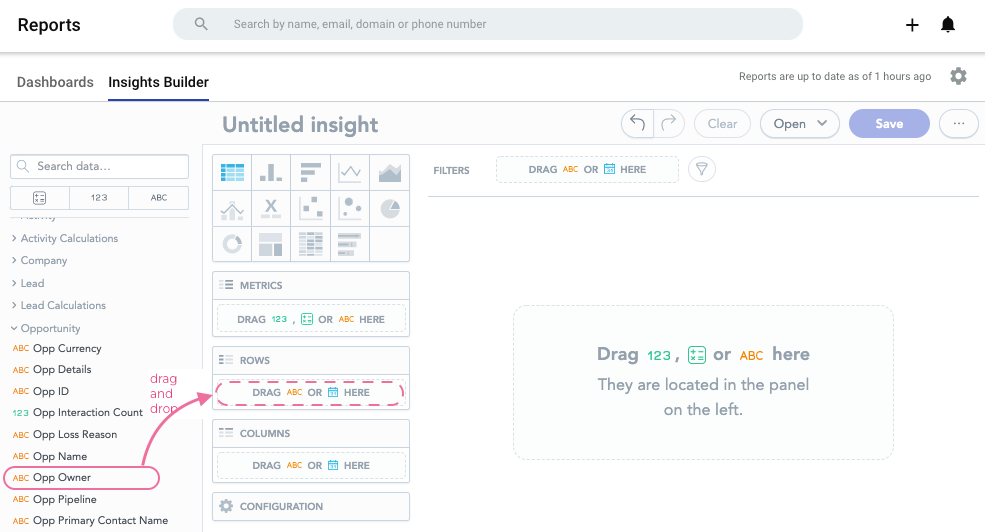
From the data picker on the left, drag and drop Opp Owner into the Rows box.
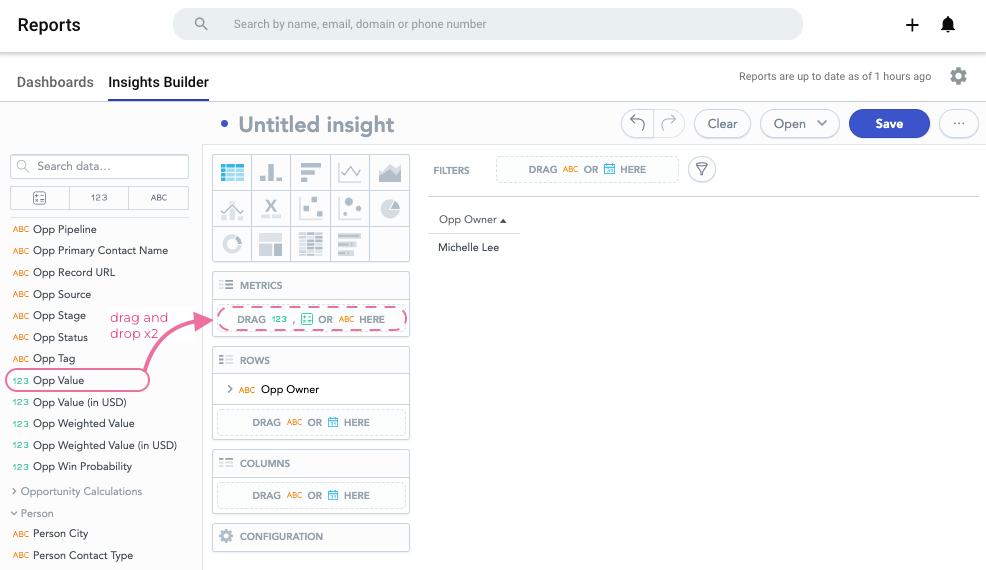
Next, we’re going to enter Opp Value into the Metrics, twice! After, we’ll adjust one to represent the sales amount and the other to represent to goal amount.
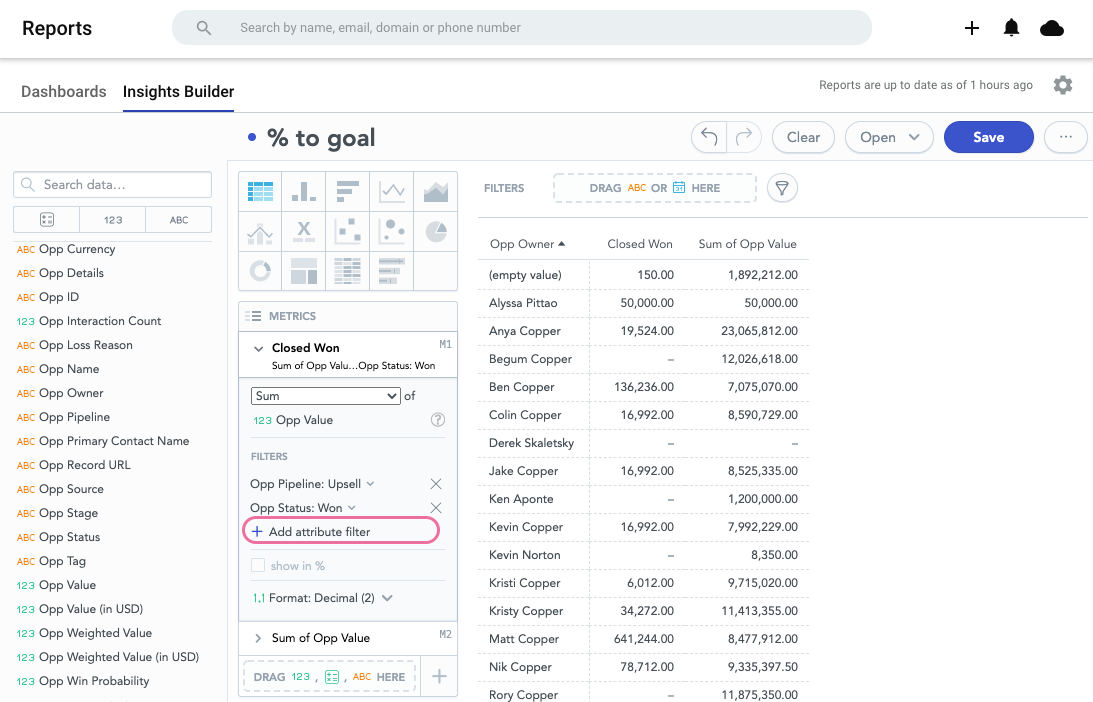
Now let’s change that first Opp Value to represent only the sales amount.
- Rename it from Sum of Opp Value to Closed Won
- Add an attribute filter for Opp Pipeline; select the Pipelines you would like to compare your goals to
- Add an attribute filter for Opp Status; select Won so that only Won opportunities are counted.
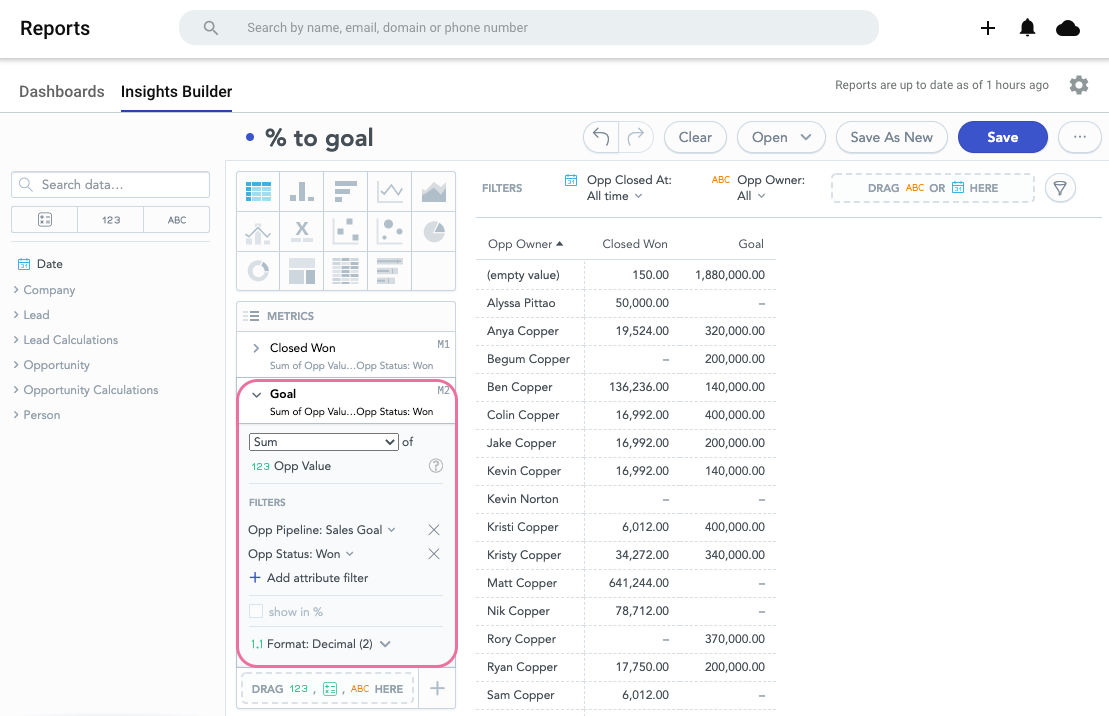
Now let’s adjust the second Opp Value to represent to Goal amount.
- Rename it from Sum of Opp Value to Goal
- Add an attribute filter for Opp Pipeline; select the Goal Pipeline only.
- Add an attribute filter for Opp Status; select Won so that only Won opportunities are counted.
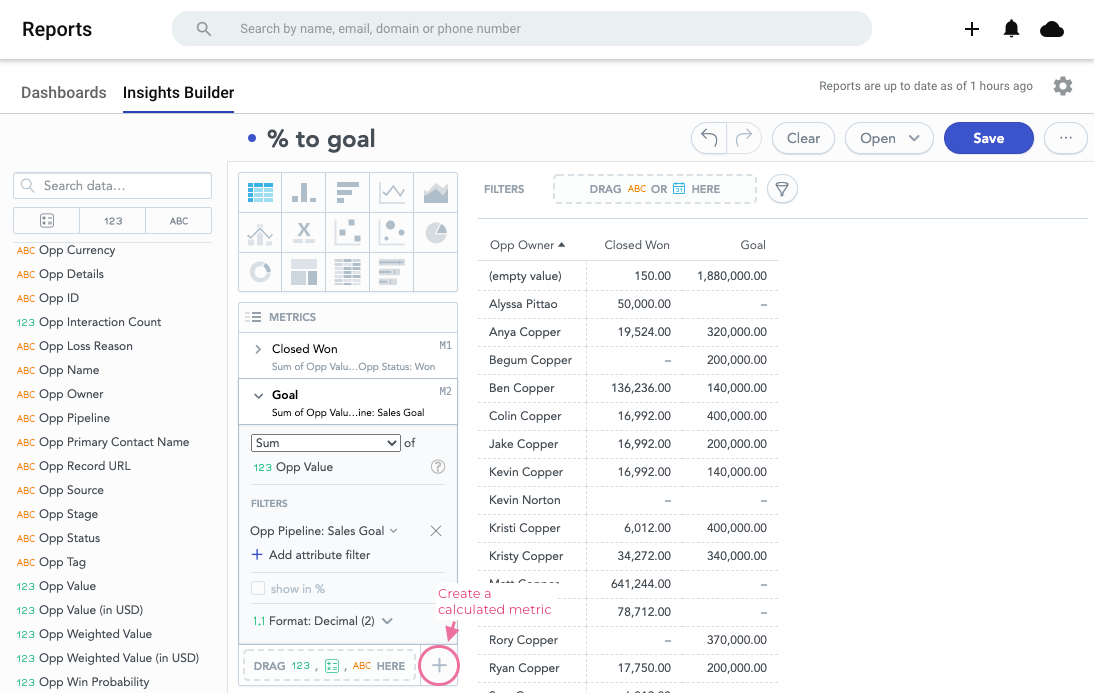
Next, let’s calculate how close to our Goals we’ve gotten. We’ll do this by creating a new metric.
Click the “+” button at the bottom right of the metrics box.
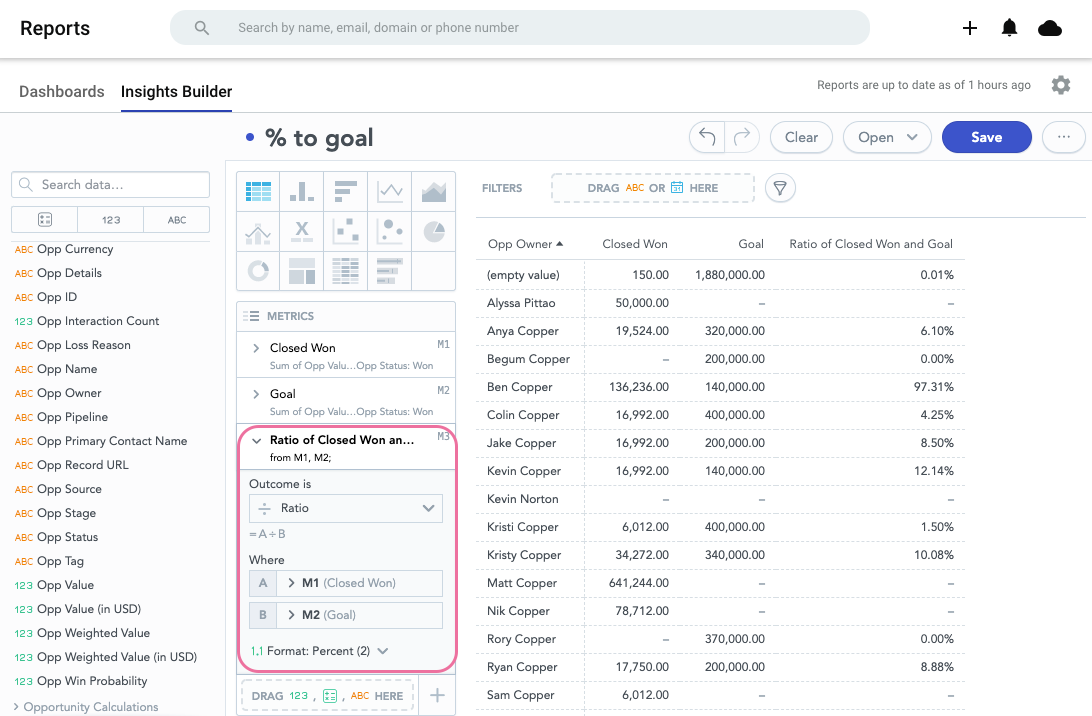
Configure your new metric.
- Change the name from Ratio of Closed Won to Goal to % to Goal or % to Quota
- Select Outcome is: Ratio
- Set A to be M1 (Closed won)
- Set B to be M2 (Goal)
- Set the Format to Percent (2)
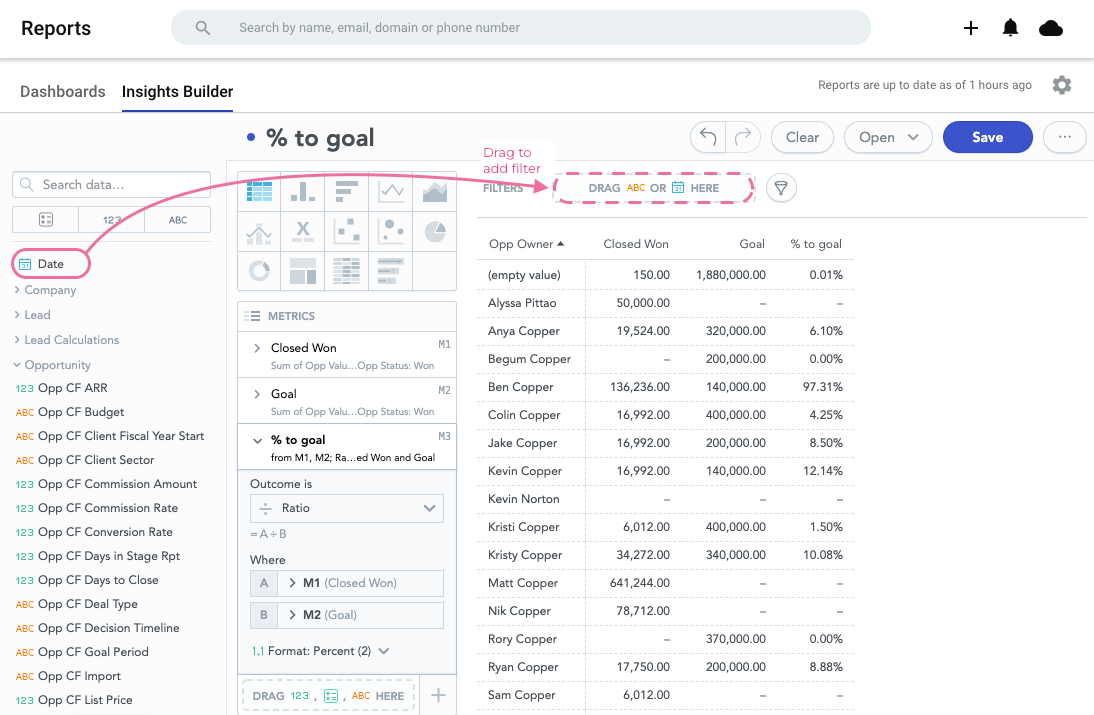
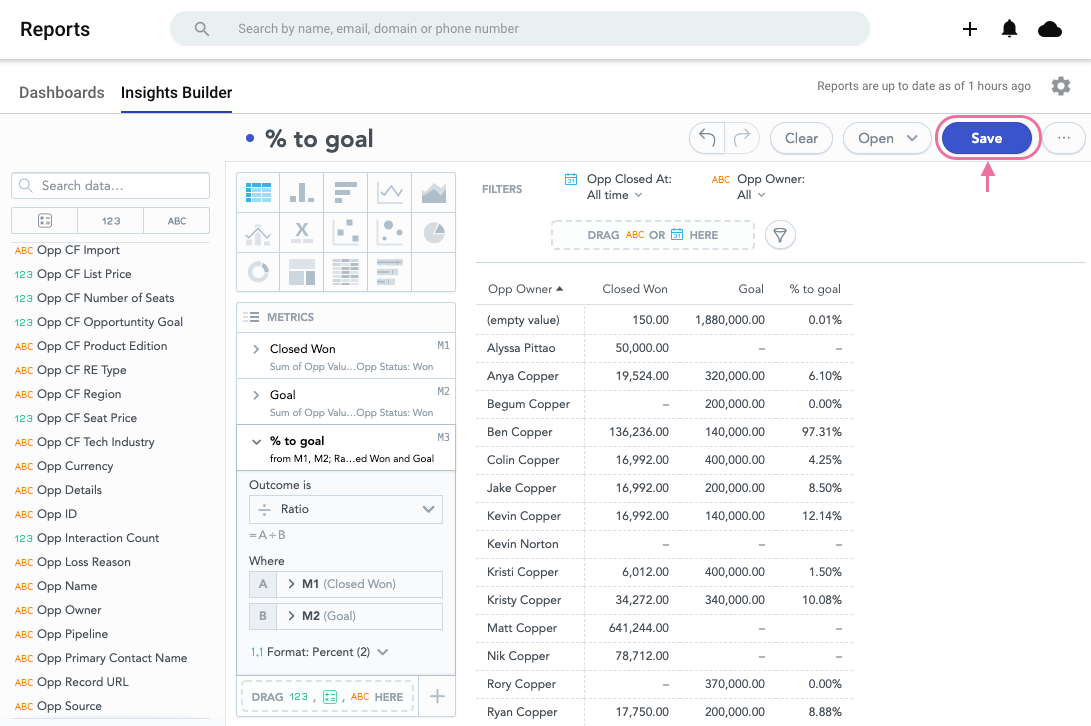
Optionally, you can add some filters at the top. We recommend adding filters for Opp Owner and Date.
Now make sure you save!
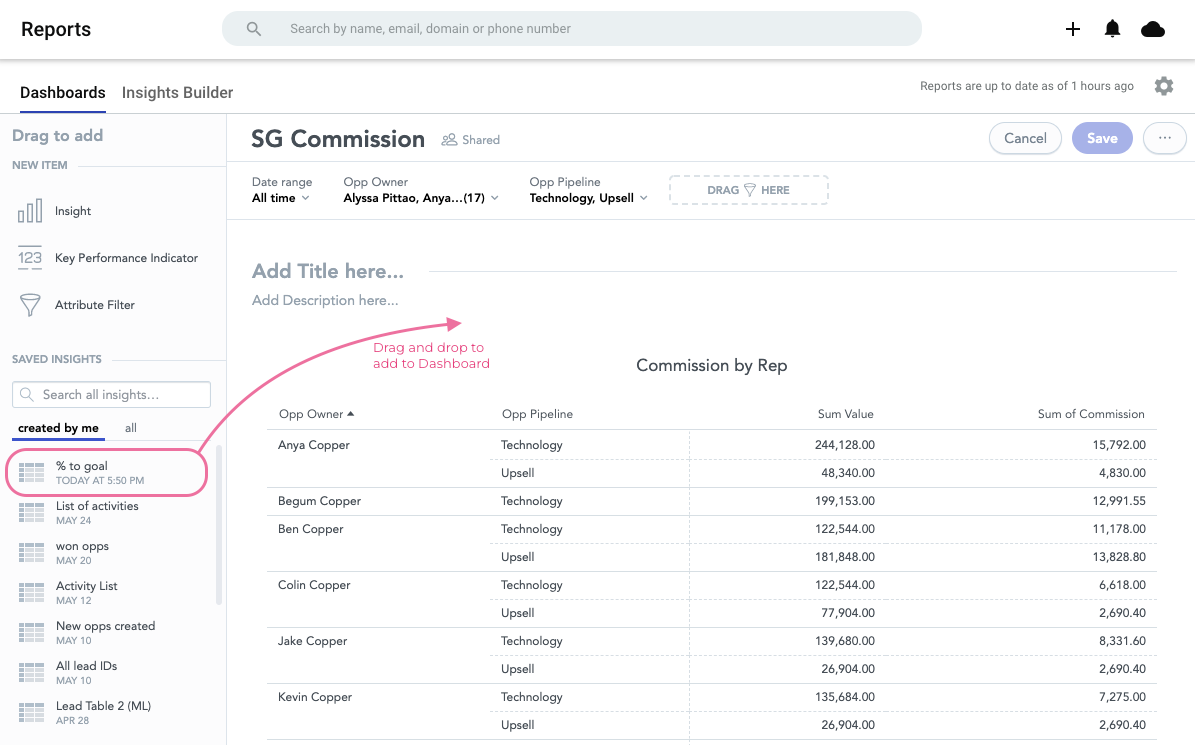
Now you can add this Insight to a Dashboard! Remember to change the date range filter on your Dashboard so that you can view the goals and attainment for a specific month or quarter.