This week, we released our re-designed list views in public beta, introduced “days in stage” to our reporting suite, improved bulk edit performance, and squashed some bugs.
List Views
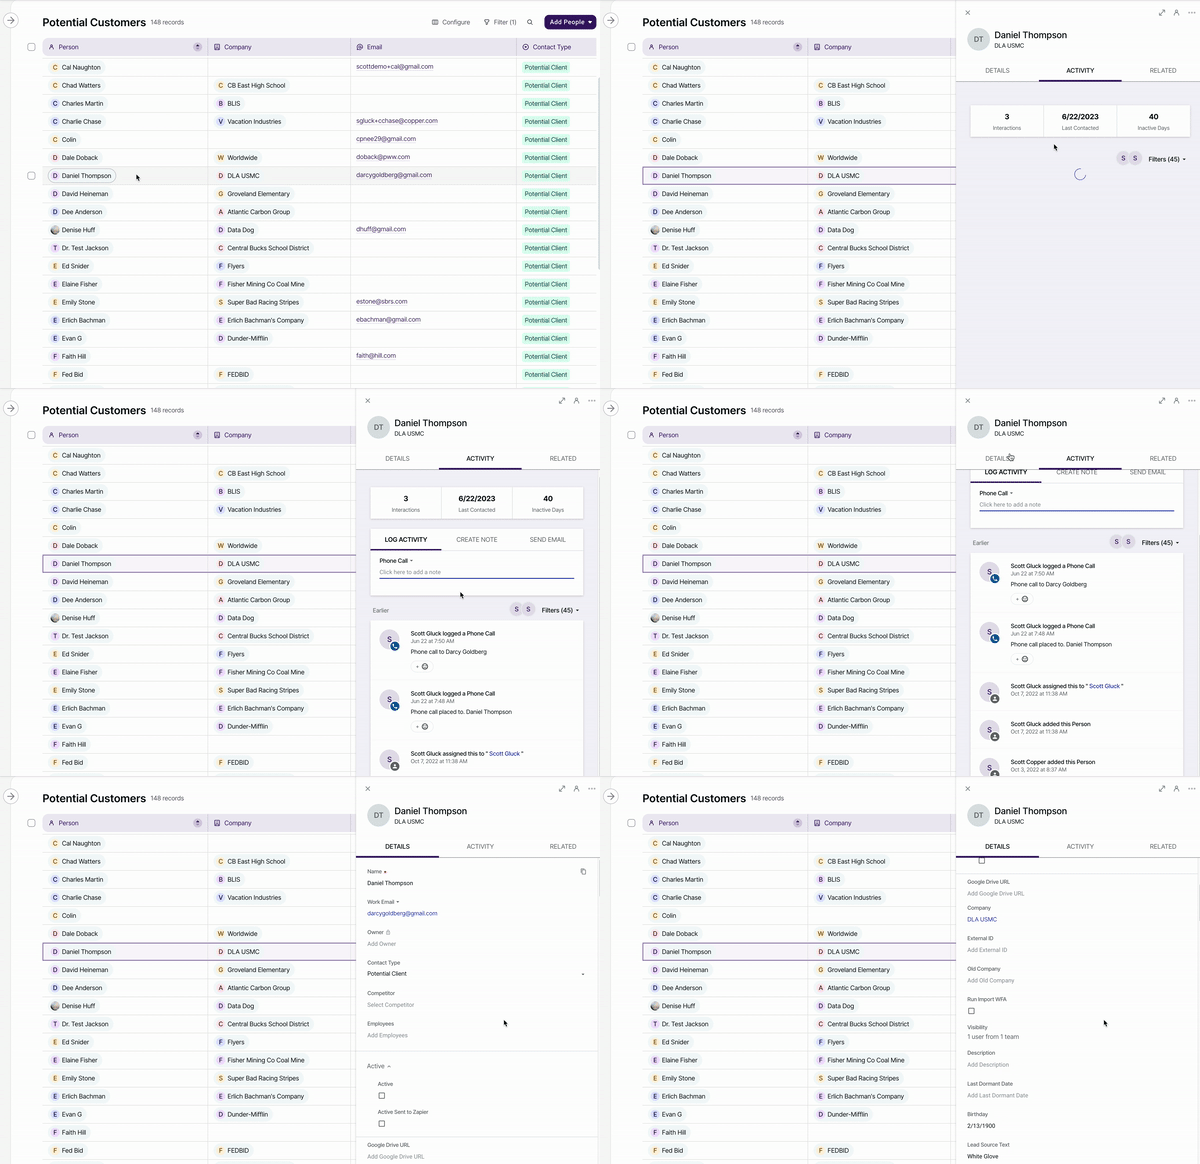
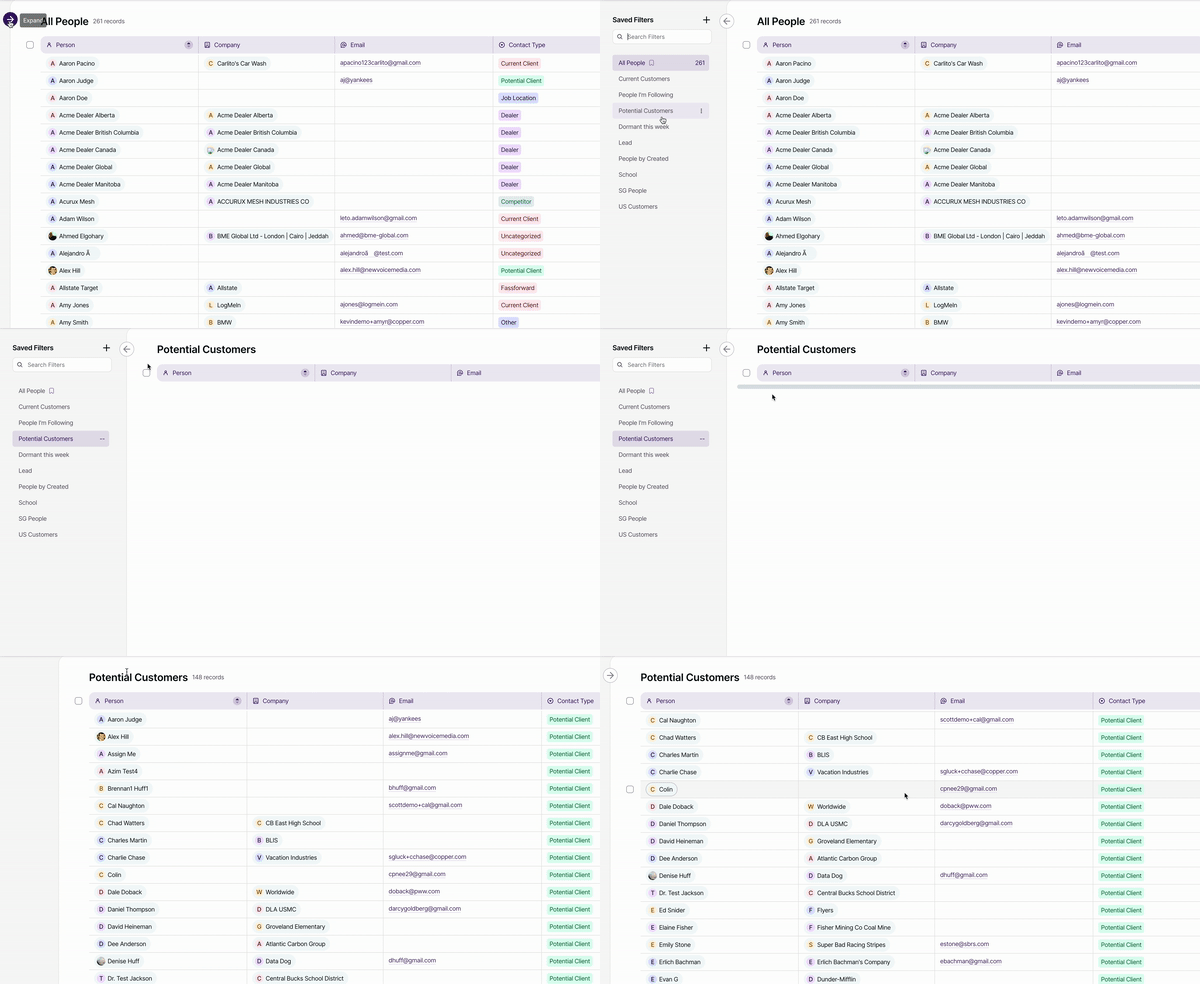
We released our re-designed list views in public beta! When viewing People, Companies, Pipelines and Tasks as a list, you’ll see a brand new design.

In addition to new colors, icons, and other design elements to make it easier to understand your data and navigate through your lists, new list views also includes:
-
Wider record preview
-
Infinite preview (preview several related records without leaving the list)
-
Saved filters panel

There’s more to come with list views! For a preview of things to come, be sure to check out our blog post, Three new features in Lists. Share any feedback on re-designed list views in our Community post.
Reports
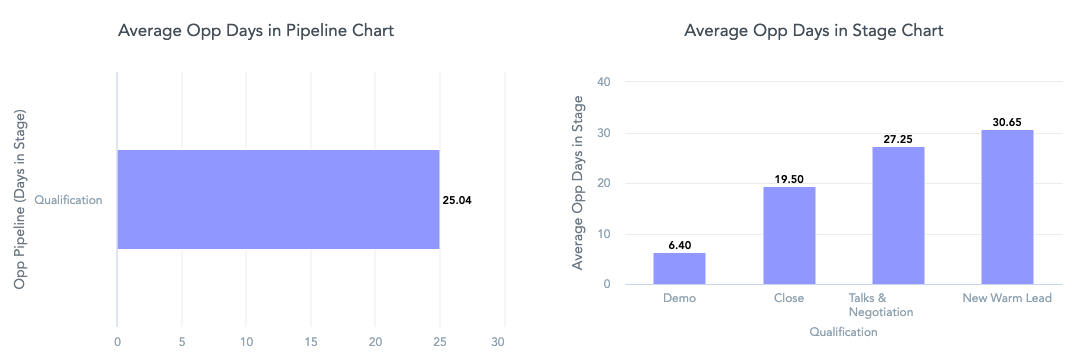
You can now add a “Days in Stage” insight to your Reports Dashboard that calculates the number of days an opportunity sits in a stage. This will help you analyze sales cycle length, identify process improvements, and better forecast to win more deals in less time.
You can find Days in stage reports in the Sales Forecast and Sales Pipeline dashboard templates, as a Saved Insight to add to an existing dashboard, or as a data item in Insights Builder to create custom reports.

Bulk Edit
We made some major performance improvements to bulk editing. All updates of 15 records or less happen instantly. Most updates of up to 100 records complete in under 1 minute. Most updates over 100 records complete in under 3 minutes.
Bugs & Enhancements
-
We fixed a few bugs that were causing errors when using the Google Sheets add-on.
-
We fixed a bug that caused the status of former users to stop displaying.
-
We made some enhancements to the Billing page to improve clarity including updating the copy from “Change” to “Upgrade.”
-
We updated the “Data Studio Reports” Settings page to “Looker Studio Reports” to reflect Google’s name change of the tool.


