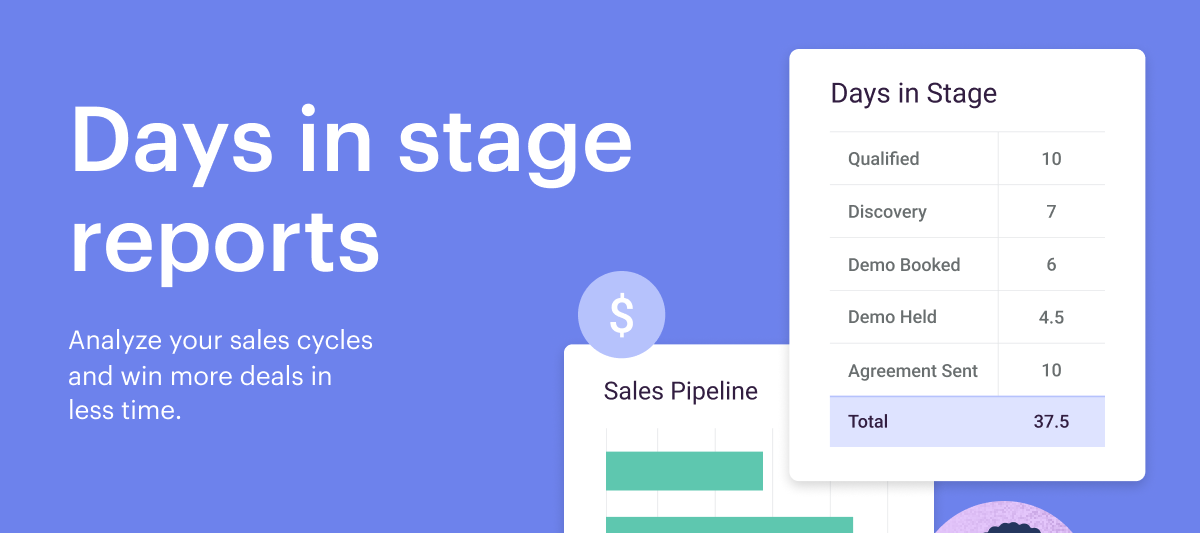
Reports just got better 💪. You can now create reports on how long opportunities sit in a pipeline stage. This data can provide powerful insights into your pipeline to help you win more deals in less time.
There are lots of ways you can use Days in stage reports, including:
- Improve processes: Easily identify opportunities that are sitting in a stage longer than average. If you notice a pattern, like multiple opportunities sitting in a particular stage for an extended period, you can hold team training aimed at helping improve the conversion rate between that stage and the next.
- Analyze performance: Compare how long it takes to close an opportunity from one referral source over another (e.g., a conference lead vs. a cold call lead). If you know that deals from a specific source close faster, you can start allocating more resources to create additional opportunities from that source.
- Forecasting: Easily calculate your sales cycle length. Sales leaders can get even more granular by combining Days in stage data with other fields to get information on things like the average sales cycle in specific industries or regions.
You can access Days in stage reports in three ways:
- Dashboard templates: For those looking to get started right away, you can find the Average Opp Days in Pipeline chart and the Average Opp Days in Stage chart in the Sales Pipeline and Sales Forecasting template.
- Pre-built insights: If you’re looking to add these reports to your existing dashboards, you can find them under “Saved Insights.” They’re available as a chart or a table.
- Building an insight: If you’re looking to build something custom, you can access a selection of facts and attributes in the Insights Builder under the “Opportunity Days in Stage” group.
For step-by-step information on setting up your Days in stage reports, check out our help article.


