How do you check how many opportunities went into a certain pipeline stage? for example, how many companies have received a demo for a certain period like January 1 2020 to June 30 2021.


Userlevel 7
 +7
+7
Hi
The easiest way to look at this is to use a Report template. This is a pre-made Report that Copper fills with your data. Afterward, you can add a filter that says: show me the Opportunities from this date range.
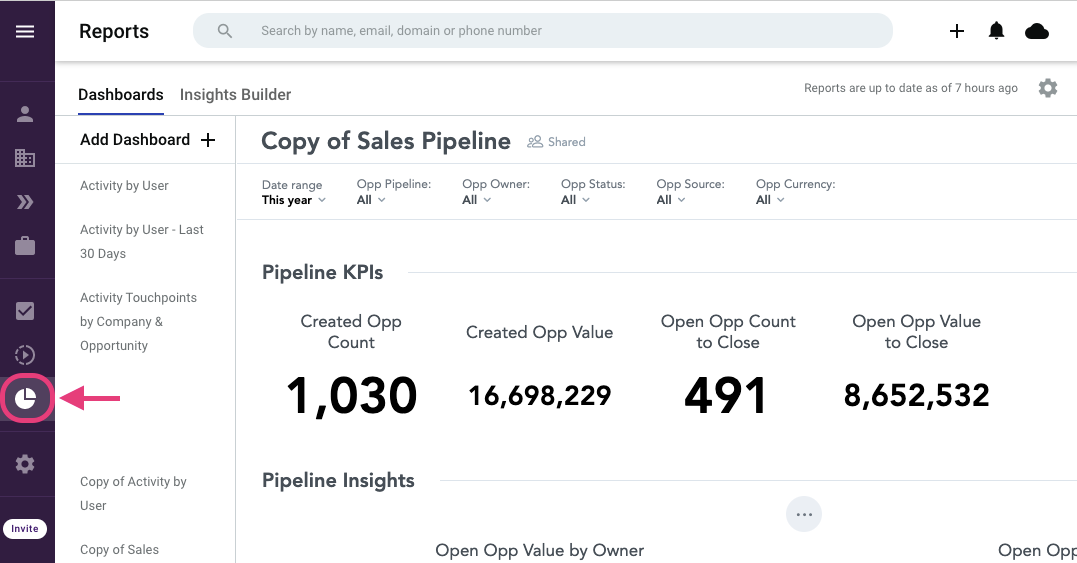
First, open up the Copper web app and click into the Reporting area. It is the icon that looks like a pie chart in the purple sidebar.
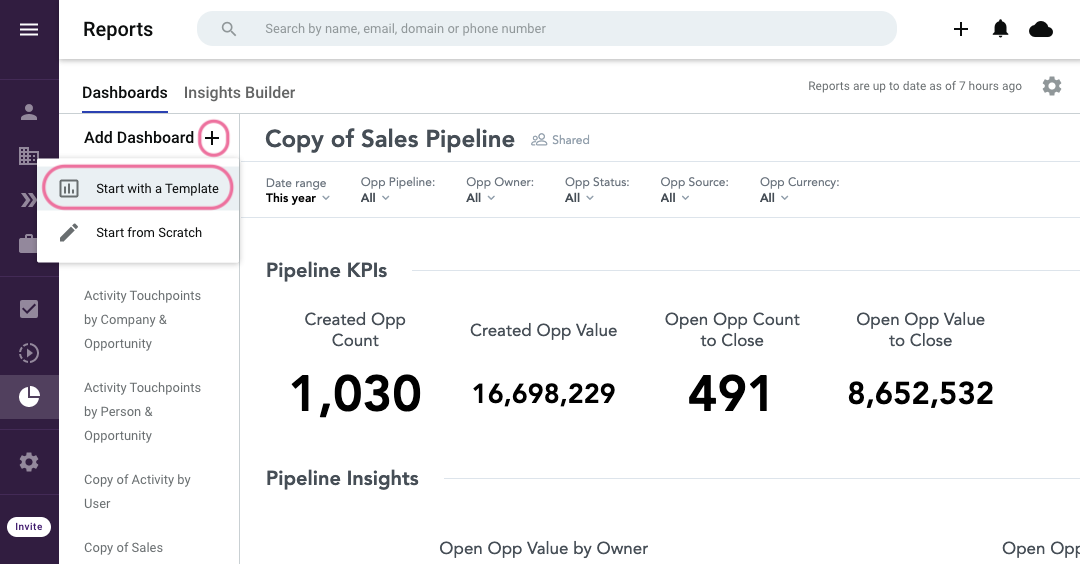
Then, go to Add Dashboard > Start with a Template
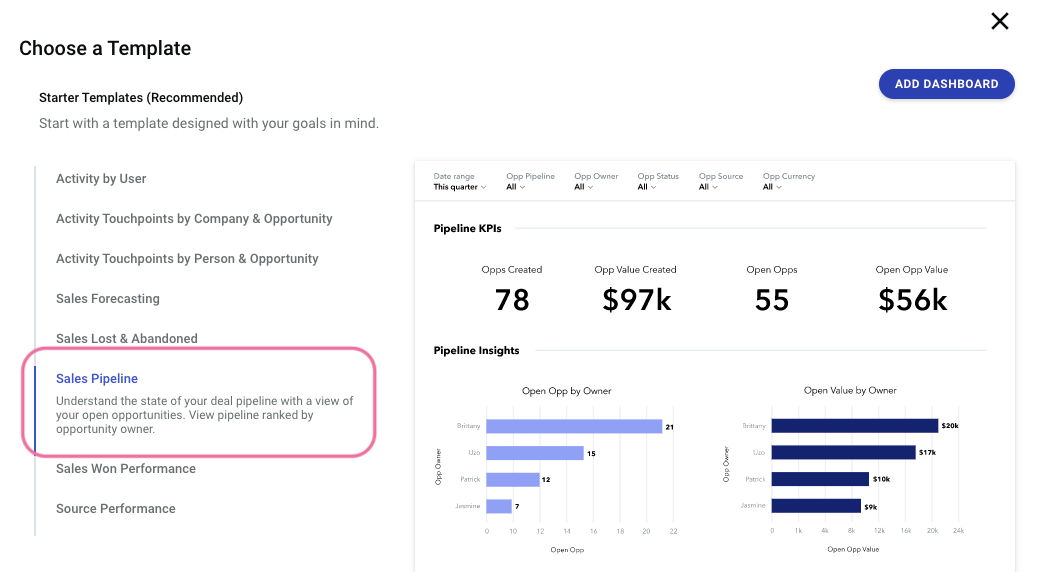
This will open a window with a bunch of templates to choose from. I recommend the one called “Sales Pipeline” and then click “Add Dashboard”
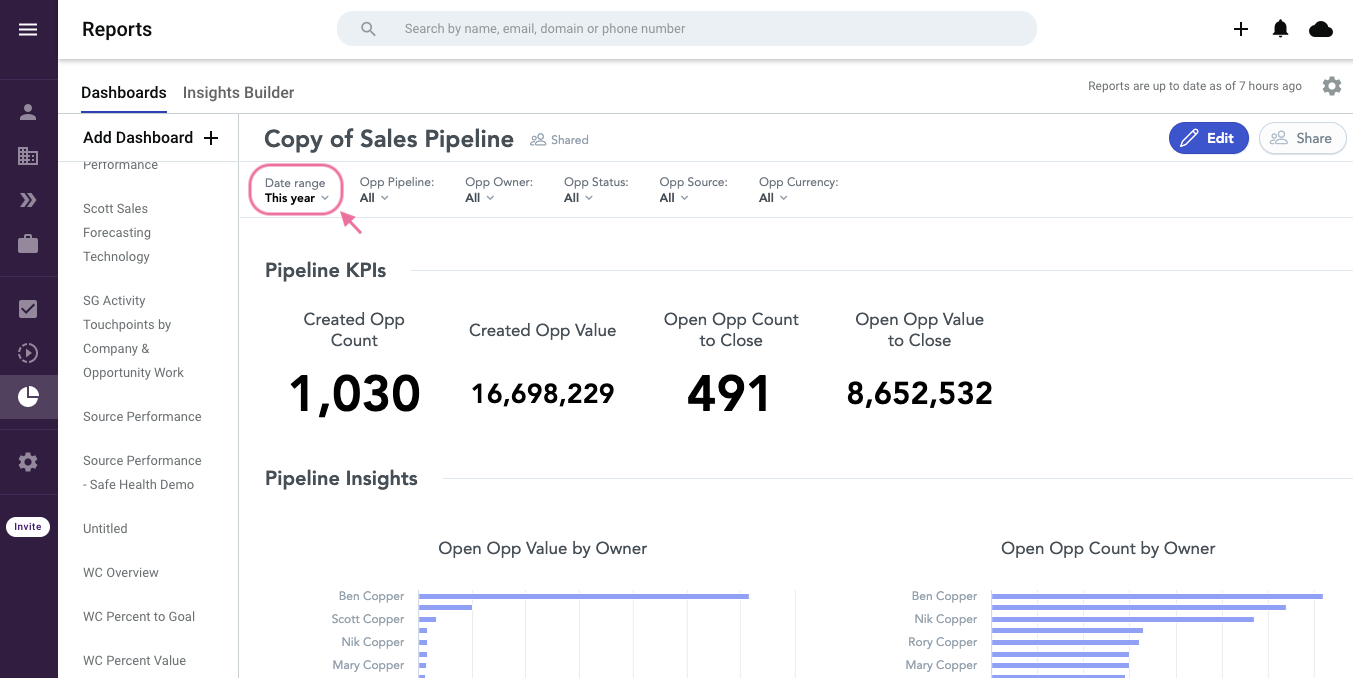
The system will generate the report for you. At the top, you will see options to adjust the date, which Pipeline, etc, etc.
If you scroll down a little bit, you’ll find a graph called “Open Opp Count by Stage”
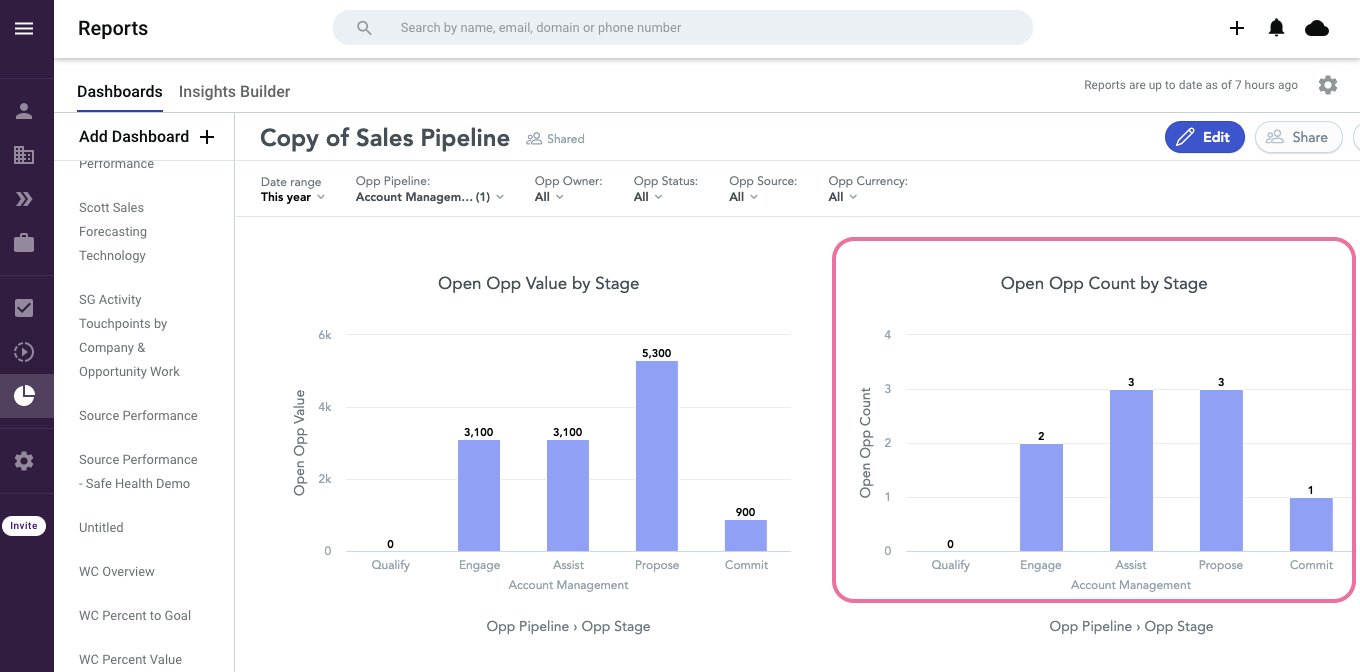
Now, I don’t have a Stage called “Demo” in my example, so let’s go with “Assist.” Let’s say we want to look at how many Opportunities went through Assist. Based on our Pipeline, we know that an Opportunity went through that Stage if it is either in that Stage, or in one of the later Stages. Looking at the graph above, I see that we have 3 in Assist + 3 in Propose + 1 in Commit = 7 opportunities.
By the way, we run a weekly Reporting Q&A, so if you prefer to talk to someone live about this question, you are welcome to join! You can register here.
Reply
Enter your username or e-mail address. We'll send you an e-mail with instructions to reset your password.